Your Zone 2 Heart Rate Is Probably Wrong. Here's How to Tell.
Most athletes find their zone 2 the same way: the talk test, the 220 minus age formula, or whatever the watch tells them. All three are wrong for a meaningful share of runners and the consequences go in both directions. Some train so easy they get almost no aerobic stimulus. Others train too hard on supposed recovery days and never let their system absorb the work.
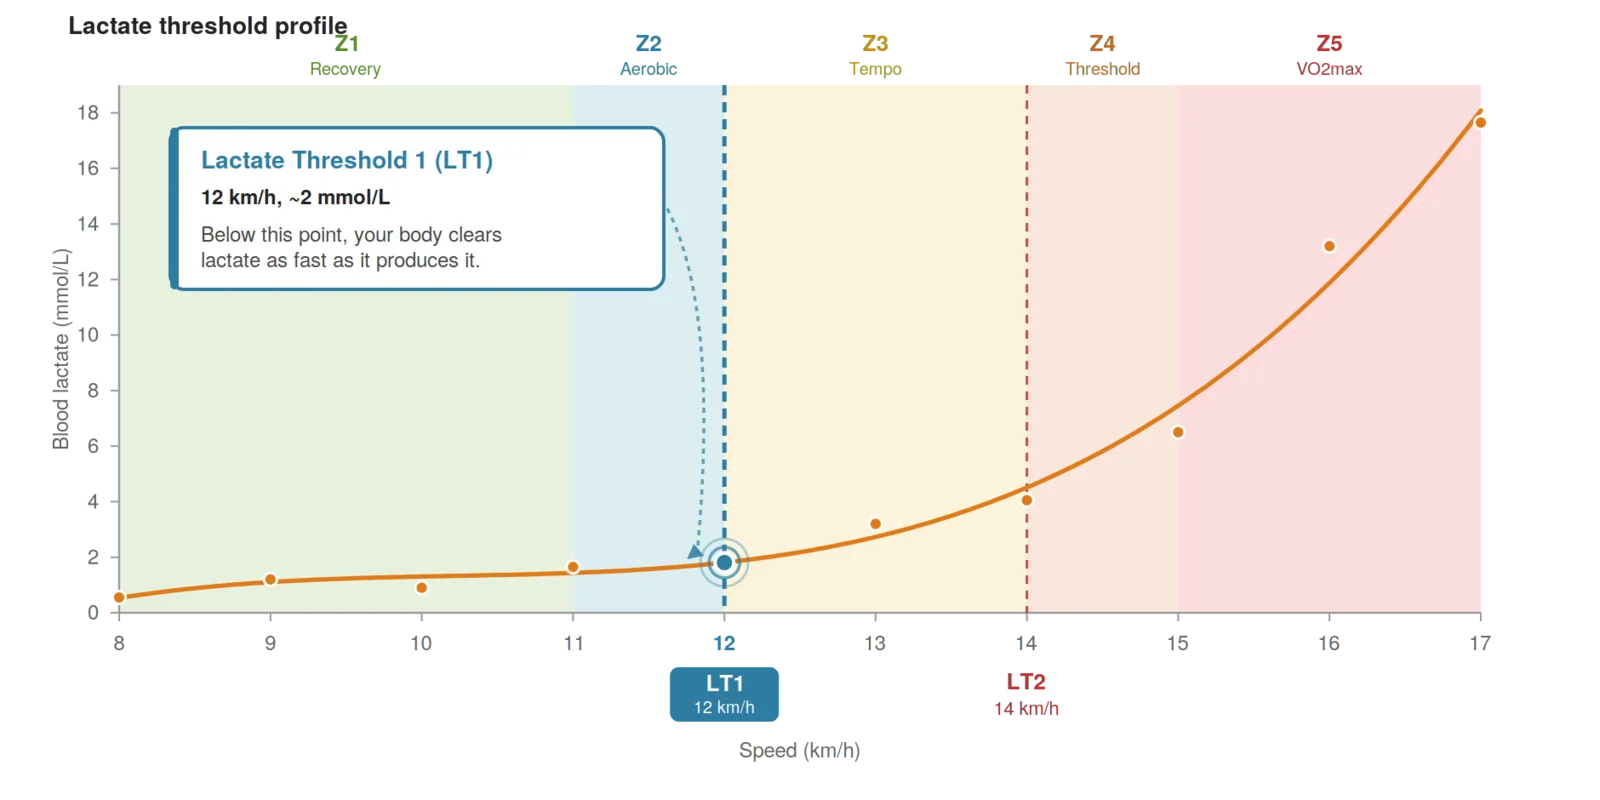
The only way to know which kind of wrong yours is is to measure your first lactate threshold (LT1) directly. Until you have that number, every method below is a guess with a margin of error you can not see.
Why your watch's zone 2 is a starting point, not an answer
Garmin's default heart rate zones use a percentage of maximum heart rate. Zone 2 sits at 60 to 70 percent of max by default. If you have not manually entered your max HR, the watch estimates it from the 220-age formula.
It is widely known that this is not accurate for most athletes.
The 220-age formula has a standard deviation of around 10 to 12 bpm in adults. That means for a meaningful share of athletes, the predicted max is off by more than 10 bpm in either direction.
Second, even with your true max HR entered, LT1 does not sit at a fixed percentage of max. Across the athletes we have tested at FitnessCheck, LT1 falls anywhere from roughly 60 percent of max HR to over 80 percent depending on the individual. A percentage based zone calculation can not know where your LT1 actually sits because that requires measuring blood lactate.
That's not to say your watch is not useful, but the formula it relies on can not capture individual variation.
Tayla's zone 2 was set at 17 beats per minute too low
Tayla is 32. Her max heart rate is 200 bpm. Her Garmin had her zone 2 set to 120 to 140 bpm as a standard formula and she had trained inside that range for years. She slowed to a walk on hills to keep her heart rate down. She thought she was doing it right.
Her actual LT1 from a lactate threshold test came back at 157 bpm and 12.3 kmph.
Her watch was telling her zone 2 capped at 140. Her physiology said her zone 2 capped at 157. She had been training 17 bpm below her aerobic ceiling at a pace far slower than her body could actually tolerate.
Her LT1 sits at 78 percent of her max HR. Garmin's default zone 2 ceiling sat at 70 percent. The gap between those two numbers was the difference between training her aerobic system efficiently and wasting her time.
The full case study, including what came out of the report and what changed in her training, is written up in Lactate Test Case Study: Garmin Zone 2 Was 17 bpm Too Low.
The opposite error happens just as often
A different client we tested had an LT1 heart rate of 125 bpm. His watch had him running easy sessions above 130 bpm because that fell inside the default zone 2 range his max HR predicted.
He had been doing the opposite of Tayla. Easy runs that were not actually easy. Recovery days that were not recovering him. He had been training too hard for years and could not understand why his volume kept plateauing.
The point is not that watches systematically overestimate or underestimate zone 2. They get it wrong in different directions for different physiologies. From inside the experience you can not tell which kind of wrong yours is.
The three field methods, ranked by how often they fail
- The talk test. You should be able to hold a full conversation in complete sentences. Works reasonably well for athletes with average breathing efficiency and average lactate kinetics. Fails for two groups. Athletes who clear lactate well can hold conversation deep into what should be threshold work. Athletes with restricted breathing or anxiety responses lose conversational ability well below their actual LT1.
- The 180-age formula (Maffetone). Take 180 minus your age. For Tayla at 32, this gives 148. Closer than her watch but still 7 bpm below her actual LT1. The Maffetone formula was designed as a conservative aerobic ceiling, not a precise LT1 estimate. It is biased low by design which means it errs toward training too easy. Fine for general health but costly if you are trying to build performance.
- Percentage of max HR. Better than 220-age if you have your actual max HR (verified from an all out effort, not the formula). Still inherits the core problem. LT1 sits anywhere from 60 to 80 percent of max across individuals. The difference between Tayla's true LT1 at 77 percent and Garmin's default zone 2 ceiling at 70 percent is the entire reason she had been training too slow for half a decade.
What your watch's lactate threshold feature is actually doing
If your Garmin, Polar or Coros reports an LTHR figure, that is its estimate of LT2, not LT1. The algorithm watches for the point where heart rate and pace decouple during a sustained effort. A 2024 validation study of the Garmin Fénix 7 underestimated lactate threshold pace by 11.96 percent compared with blood lactate field testing.
Even if your watch's LT2 estimate is reasonably accurate, that does not give you LT1. The two thresholds are independent. The gap between them varies between athletes from around 10 bpm to over 30 bpm. Setting zone 2 as a fixed percentage below LT2 introduces a second layer of error on top of the first.
We are writing a longer post on watch accuracy specifically. For now, the takeaway is that trend data from your watch is useful. Absolute numbers are a starting point, not a target.
Five signs your zone 2 estimate is wrong
You can not measure it directly without a test. But there are signals.
- Your legs feel heavy three or four days a week. Easy runs that should leave you fresh are leaving you accumulating fatigue. This usually means you are running above LT1 on supposed easy days.
- You can not build weekly volume without breakdown. Adding 10 percent per week should be sustainable. If it is not, your easy work is not actually easy.
- Your pace slows across a long run while effort feels constant. Heart rate cardiac drift is normal in the back half of any long run. But if you're having to slow down to keep effort feeling easy, the starting pace was probably above LT1.
- You finish easy sessions tired rather than recovered. The whole point of zone 2 is that it should feel submaximal in a way that builds capacity without costing you the next session.
- Or the opposite signal. You are forcing yourself to walk every small hill to stay in zone 2 and your easy runs feel pointlessly slow. Your zone 2 ceiling is probably set too low. That was Tayla.
When the cost of guessing exceeds the cost of testing
Field methods are fine when the cost of being wrong is low. Recreational runner training three hours a week with no specific goal? The 180-age formula gets you close enough that the worst case is moderate inefficiency.
The cost rises with your training load. Five or more hours a week with a performance goal means weeks of fatigue from miscalibrated easy days and adaptations you are not getting because you are training the wrong system. At that point the cost of guessing exceeds the cost of testing.
If you have been targeting a zone 2 heart rate range for a while and not seeing the improvements that volume should produce, it is worth checking whether you have been training the system you think you have been training. The signal you are looking for is what Tayla found.
Related reading
- To work out whether testing makes sense for where you are in your training, read Do You Actually Need a Lactate Threshold Test? An Honest Answer.
- To see what comes back in a lactate threshold test report, read What's Actually in a Lactate Threshold Test Report.
- For Hyrox athletes specifically, Why You Blow Up in the Second Half of a Hyrox covers how LT2 governs that specific failure mode.
We test athletes from across South Wales at Team Rees in Caerphilly. A 60 minute appointment, real blood lactate readings, a full written report and your true LT1 and LT2 in numbers. Book a session here.
Ready to find your lactate threshold?
Book a test at one of our partner gyms and get a personalised training zone report.
Book a Test