Your Watch's "Lactate Threshold" Feature Isn't Measuring Your Lactate Threshold
Your Garmin gives you a lactate threshold heart rate. It never took a drop of your blood. That number is an estimate produced by an algorithm, not a measurement of your lactate and when we check it against real blood testing it is wrong every time by as much as 20 bpm.
If you are setting your training zones from it you are building your whole training around a guess dressed up as a measurement. Here is how the watch actually generates that number, what we found when we measured the real thing and what that costs you.
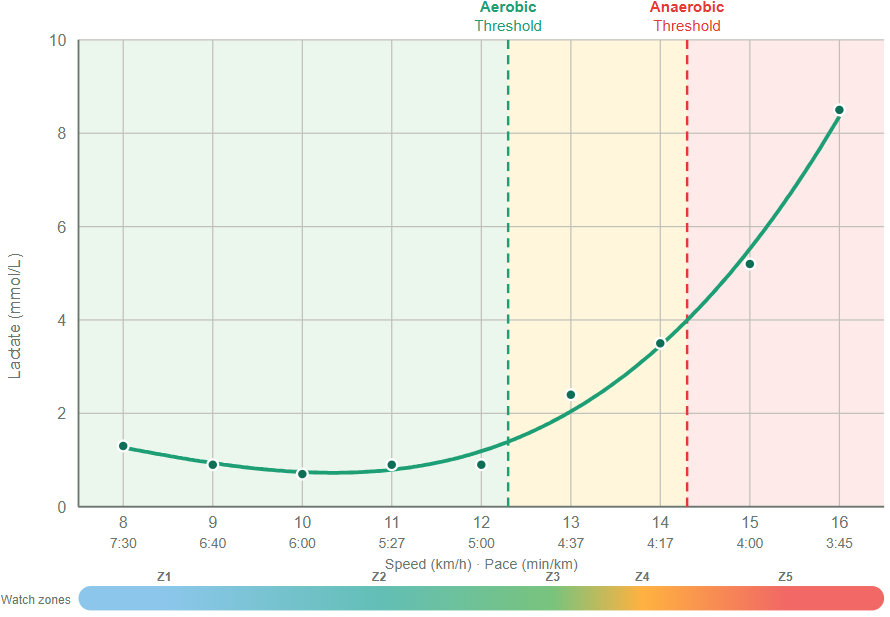
What your watch is actually doing
Measuring lactate requires a blood sample.
What the watch does instead is run an algorithm, Firstbeat Analytics in Garmin's case, looks at the relationship between your heart rate and your pace during a run and estimates the point where your effort tips from aerobic to anaerobic. It leans on your existing VO2 max estimate, which is itself an algorithmic estimate, so the lactate threshold number is an estimate built on top of another estimate.
Until recently Garmin derived this from heart rate variability, which needs a chest strap to read accurately during hard efforts. Newer models switched to optical wrist heart rate, which is less reliable at high intensity. So for athletes the feature became less accurate at exactly the job it is named after.
None of this is hidden, but the name does a lot of quiet work. Calling it a lactate threshold borrows the authority of a blood test for a number that never came near your blood.
What we found when we measured the real thing
We took the last five athletes who each had a lactate threshold heart rate from their watch and we measured their actual anaerobic threshold with blood lactate testing. Here is what the watch said next to what their physiology actually was.
Athlete A: watch 170, measured 155. Wrong by 15.
Athlete B: watch 175, measured 168. Wrong by 7.
Athlete C: watch 165, measured 185. Wrong by 20.
Athlete D: watch 168, measured 178. Wrong by 10.
Athlete E: watch 169, measured 152. Wrong by 17.
The watch estimates sit in a narrow band from 165 to 175. The real measured values run from 152 all the way to 185, a spread of 33 beats per minute. The watch could barely tell these five athletes apart and their actual physiology was enormously different.
That is exactly what you would expect from a number based on population averages. An average is right for the person who happens to sit at the average and wrong for everyone else, and it has no way of telling you which one you are. Athlete C was training with a threshold set 20 bpm too low. Athlete E was training with one set 17 bpm too high. Same feature, opposite errors, and neither athlete had any way to know from the watch alone.
Our five sit in line with the published research, which finds an average error of around 11 bpm for watch estimated threshold heart rate against lab testing. The error is a feature not a bug.
Why the error runs in both directions
The most important thing in that table is not the size of the error. It is that you cannot predict which way it points.
If watches were simply always a bit high, you could mentally adjust. But Athlete C's watch was 20 low and Athlete E's was 17 high. The error is not a consistent bias you can correct for. It is unpredictable because the watch is fitting each person to a model built on everyone else, and real people scatter around that model in both directions.
This is what makes the number unsafe to train from. A wrong number you could reliably correct would still be useful. A wrong number that could be high or low by up to 20 bpm, with no way to tell, is worse than no number because it comes with false confidence.
What the gap costs your training
Set your zones from a threshold that is too high and your easy runs are not easy. You train the grey zone every day, accumulate fatigue, and never build the aerobic base, the exact pattern we wrote about in our Zone 2 post. Set it too low and your hard sessions are not hard enough and you leave adaptation unclaimed.
Either way, every zone downstream of that threshold is off, because the zones are calculated from it. One wrong anchor number and the whole system is wrong. You can have the discipline to hit your zones perfectly and still be training in the wrong place, because the target itself was never yours.
What we do instead
We measure it. During a graded test we take a small blood sample from the earlobe at each stage and read your actual lactate against your heart rate and pace. That gives us the real point where your metabolism shifts, not an estimate of it, and from that we set your zones to your physiology.
For all five athletes above, we recalibrated their zones on the using their measured numbers. From their very next session they were training in the right place instead of the wrong one.
If you have been training from your watch's lactate threshold and something has never felt right, this is the test that tells you whether the number was ever yours. For how the same estimate problem shows up with cycling power, read our FTP and lactate testing post. If you are deciding which test to book, read our guide to choosing a test.
We test in multiple convenient locations across South Wales and now Bristol as well.
Ready to find your lactate threshold?
Book a test at one of our partner gyms and get a personalised training zone report.
Book a Test