How Your Lactate Threshold Test Maps to Garmin's 5 Heart Rate Zones
Your lactate test gives you two very important numbers: your aerobic threshold and your anaerobic threshold. Your Garmin shows five zones. The mapping is simpler than it looks. Your anaerobic threshold is the line between Zone 4 and Zone 5. Your aerobic threshold sits roughly at the line between Zone 2 and Zone 3.
The difference is that your watch slices the zones into five but your physiology into three.
Here is how to line them up, and the one setting to change so your Garmin actually runs on your real numbers.
What your watch's 5 zones actually are
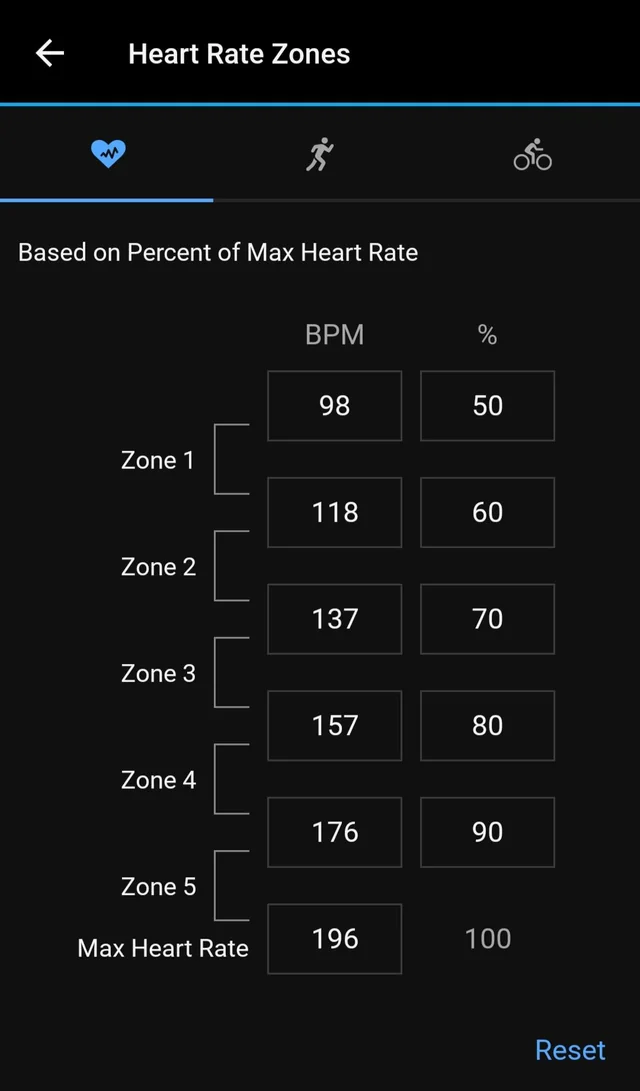
Garmin builds your five zones as percentages of your maximum heart rate. The defaults are:
- Zone 1: below 60% of max
- Zone 2: 60 to 70%
- Zone 3: 70 to 80%
- Zone 4: 80 to 90%
- Zone 5: 90 to 100%
The problem: unless you have entered your true max, the watch estimates it from 220 minus your age. That formula has a spread of around 10 to 12 bpm (beats per minute) across adults, so for a lot of people every zone boundary is built on a number that is already wrong. And even with an accurate max, the percentages are population averages. They do not know where your thresholds sit.
Your test gives you 2 thresholds and 3 zones
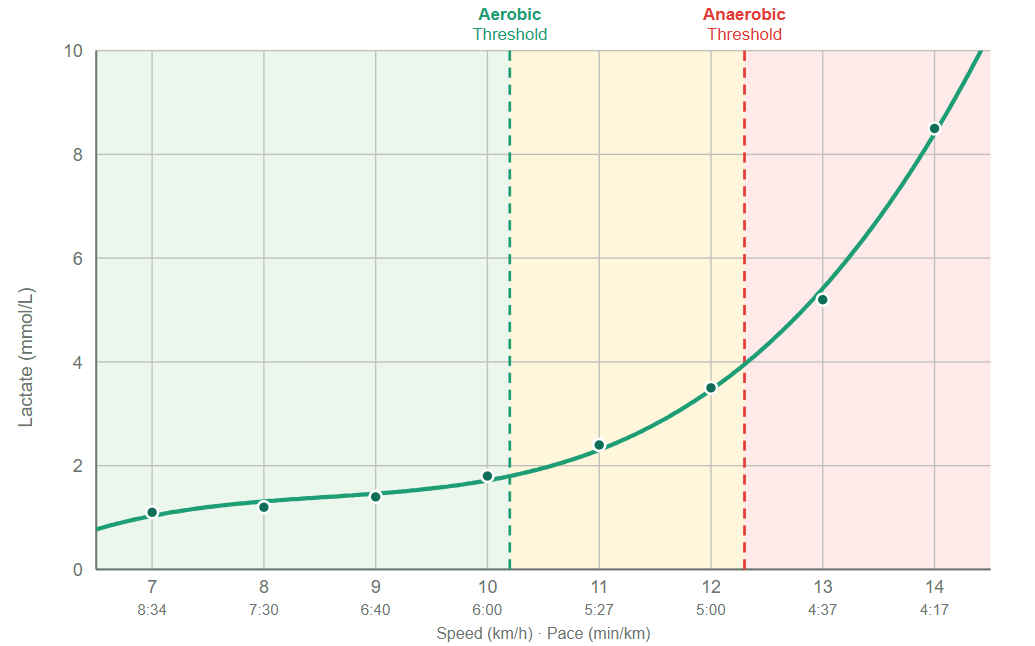
A lactate test measures the real thing: blood lactate at increasing intensities. It returns two thresholds.
Your aerobic threshold (often referred to as LT1) is where lactate first lifts above resting level. Below it, you produce and clear lactate well and can hold the effort for a long time. This is the top of true easy running.
Your anaerobic threshold (often referred to as LT2) is where lactate starts accumulating faster than your body can clear it. Above this point there is no steady state and the clock is running on how long you can hold on.
Those two lines create three bands:
- Below your aerobic threshold: easy, sustainable, the aerobic base.
- Between the two thresholds: lactate is climbing, but a semi-steady state is still possible.
- Above your anaerobic threshold: accumulation outruns clearance.
How the 3 map onto the 5
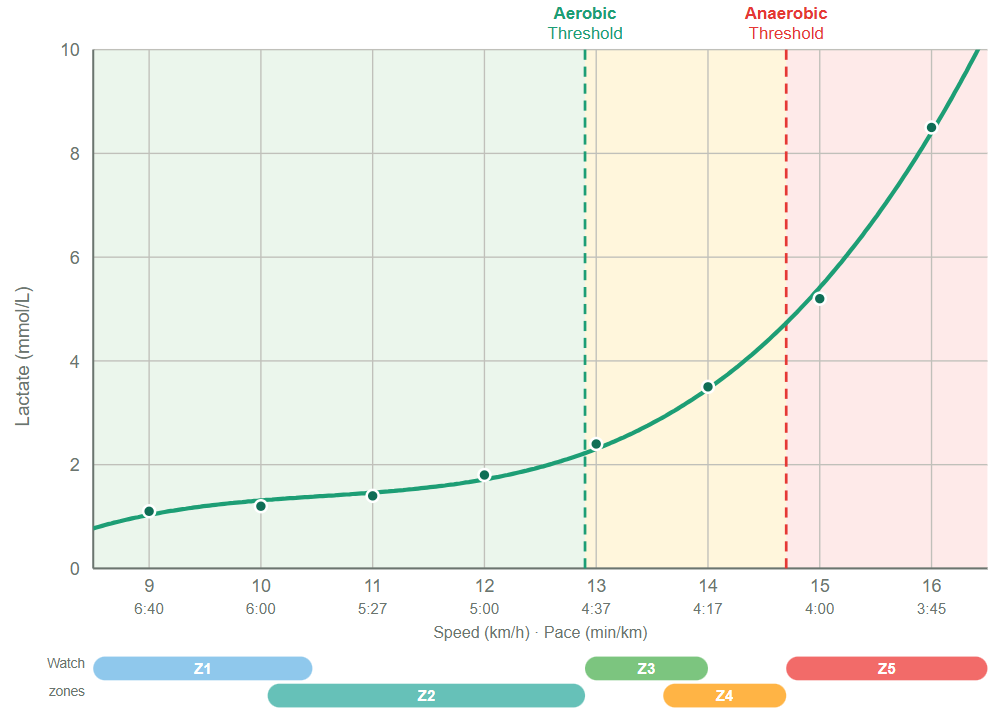
Line the two systems up and the thresholds become the anchors:
- On Garmin, your anaerobic threshold is the Zone 4 / Zone 5 boundary.
- Your aerobic threshold sits near the Zone 2 / Zone 3 boundary, usually a touch into Zone 3.
Take Tayla, one of our athletes. Her test came back with an aerobic threshold of 157 bpm (12.3 km/h) and an anaerobic threshold of 172 bpm (14.6 km/h), against a measured max of 201.
When we gave Garmin the information about her Lactate Threshold Heart Rate (LTHR), her zones were rebuilt more accurately:
- Zone 2 ceiling: 153 bpm
- Zone 3: 153 to 162 bpm
- Zone 4: 163 to 172 bpm
- Zone 5: 172 bpm and up
Her anaerobic threshold (172) is the Zone 4/5 line exactly on her watch. Her aerobic threshold (157) lands in the bottom of Zone 3. For years her Garmin had capped Zone 2 at 140, which is why she had been running 17 bpm too easy. We covered that in full in Lactate Test Case Study: Garmin Zone 2 Was 17 bpm Too Low.
The one number to change: your LTHR
You do not need to rebuild all five zones by hand. Change one input and Garmin recalculates the rest.
Switch your heart rate zones from "% Max HR" to "% LTHR" (lactate threshold heart rate), then enter your measured anaerobic threshold heart rate as your LTHR. The watch rebuilds all five zones around it in seconds. % LTHR is also the only Garmin method that keeps updating as your fitness changes, and it does not depend on a correct max HR.
For Tayla, that single change moved her Zone 2 ceiling from 140 to 153 and put her threshold work in the right place for the first time. If you want the physiology behind why the default was so far out, read Your Zone 2 Heart Rate Is Probably Wrong. Here's How to Tell.
Why your aerobic threshold still won't line up perfectly
Setting your LTHR fixes the top end precisely, because your anaerobic threshold is the actual input. The bottom end is still a formula. Garmin's % LTHR default puts the Zone 2 ceiling at 89% of your LTHR. For Tayla that is 153 bpm. Her measured aerobic threshold is 157. Close, but the formula set her easy ceiling 4 bpm low, because it is estimating where your aerobic threshold sits from your anaerobic one rather than measuring it.
So keep your aerobic threshold number in your head as the real ceiling for easy runs, even after recalibrating. For Tayla that is 157, not the 153 the watch shows as the top of Zone 2.
If you want the exact boundary, you can edit all five zones manually in BPM instead of using % LTHR. If you plan on getting your lactate thresholds tested regularly, this is the better choice. However if you don’t, be aware that this will lock your zones in and Garmin won’t update them over time.
With the above method, you will be confident about the two boundaries the test actually measured (the Zone 2/3 line at your aerobic threshold, the Zone 4/5 line at your anaerobic threshold) but still estimating the others. The Zone 1/2 and Zone 3/4 splits are educated guesses.
Setting it up on Garmin
You can do this on the watch on most current models or in the Garmin Connect app. Menus vary by model, so look yours up if the path differs but the shape is the same:
- Open your heart rate zone settings (Garmin Connect: User Settings, then Heart Rate. On the watch: hold the up button, then Zones).
- Set "Based On" to % LTHR.
- Enter your measured anaerobic threshold as your lactate threshold heart rate.
- Sync. Your five zones rebuild automatically.
To set every boundary by hand instead, choose the BPM or Custom option and enter each zone yourself, using your aerobic threshold for the Zone 2/3 line and your anaerobic threshold for the Zone 4/5 line.
A note on accuracy over time: Garmin updates its software regularly, and the exact menus differ across models. As of today you can set both your LTHR and the five individual zone boundaries, either on the watch on many models or through Garmin Connect. If the steps here no longer match what you see, message us and we will update this post.
We test runners and Hyrox athletes from across South Wales at Team Rees in Caerphilly. One 60 minute session gives you your real aerobic and anaerobic thresholds in numbers you can put straight into your watch. Book a session.
Ready to find your lactate threshold?
Book a test at one of our partner gyms and get a personalised training zone report.
Book a Test